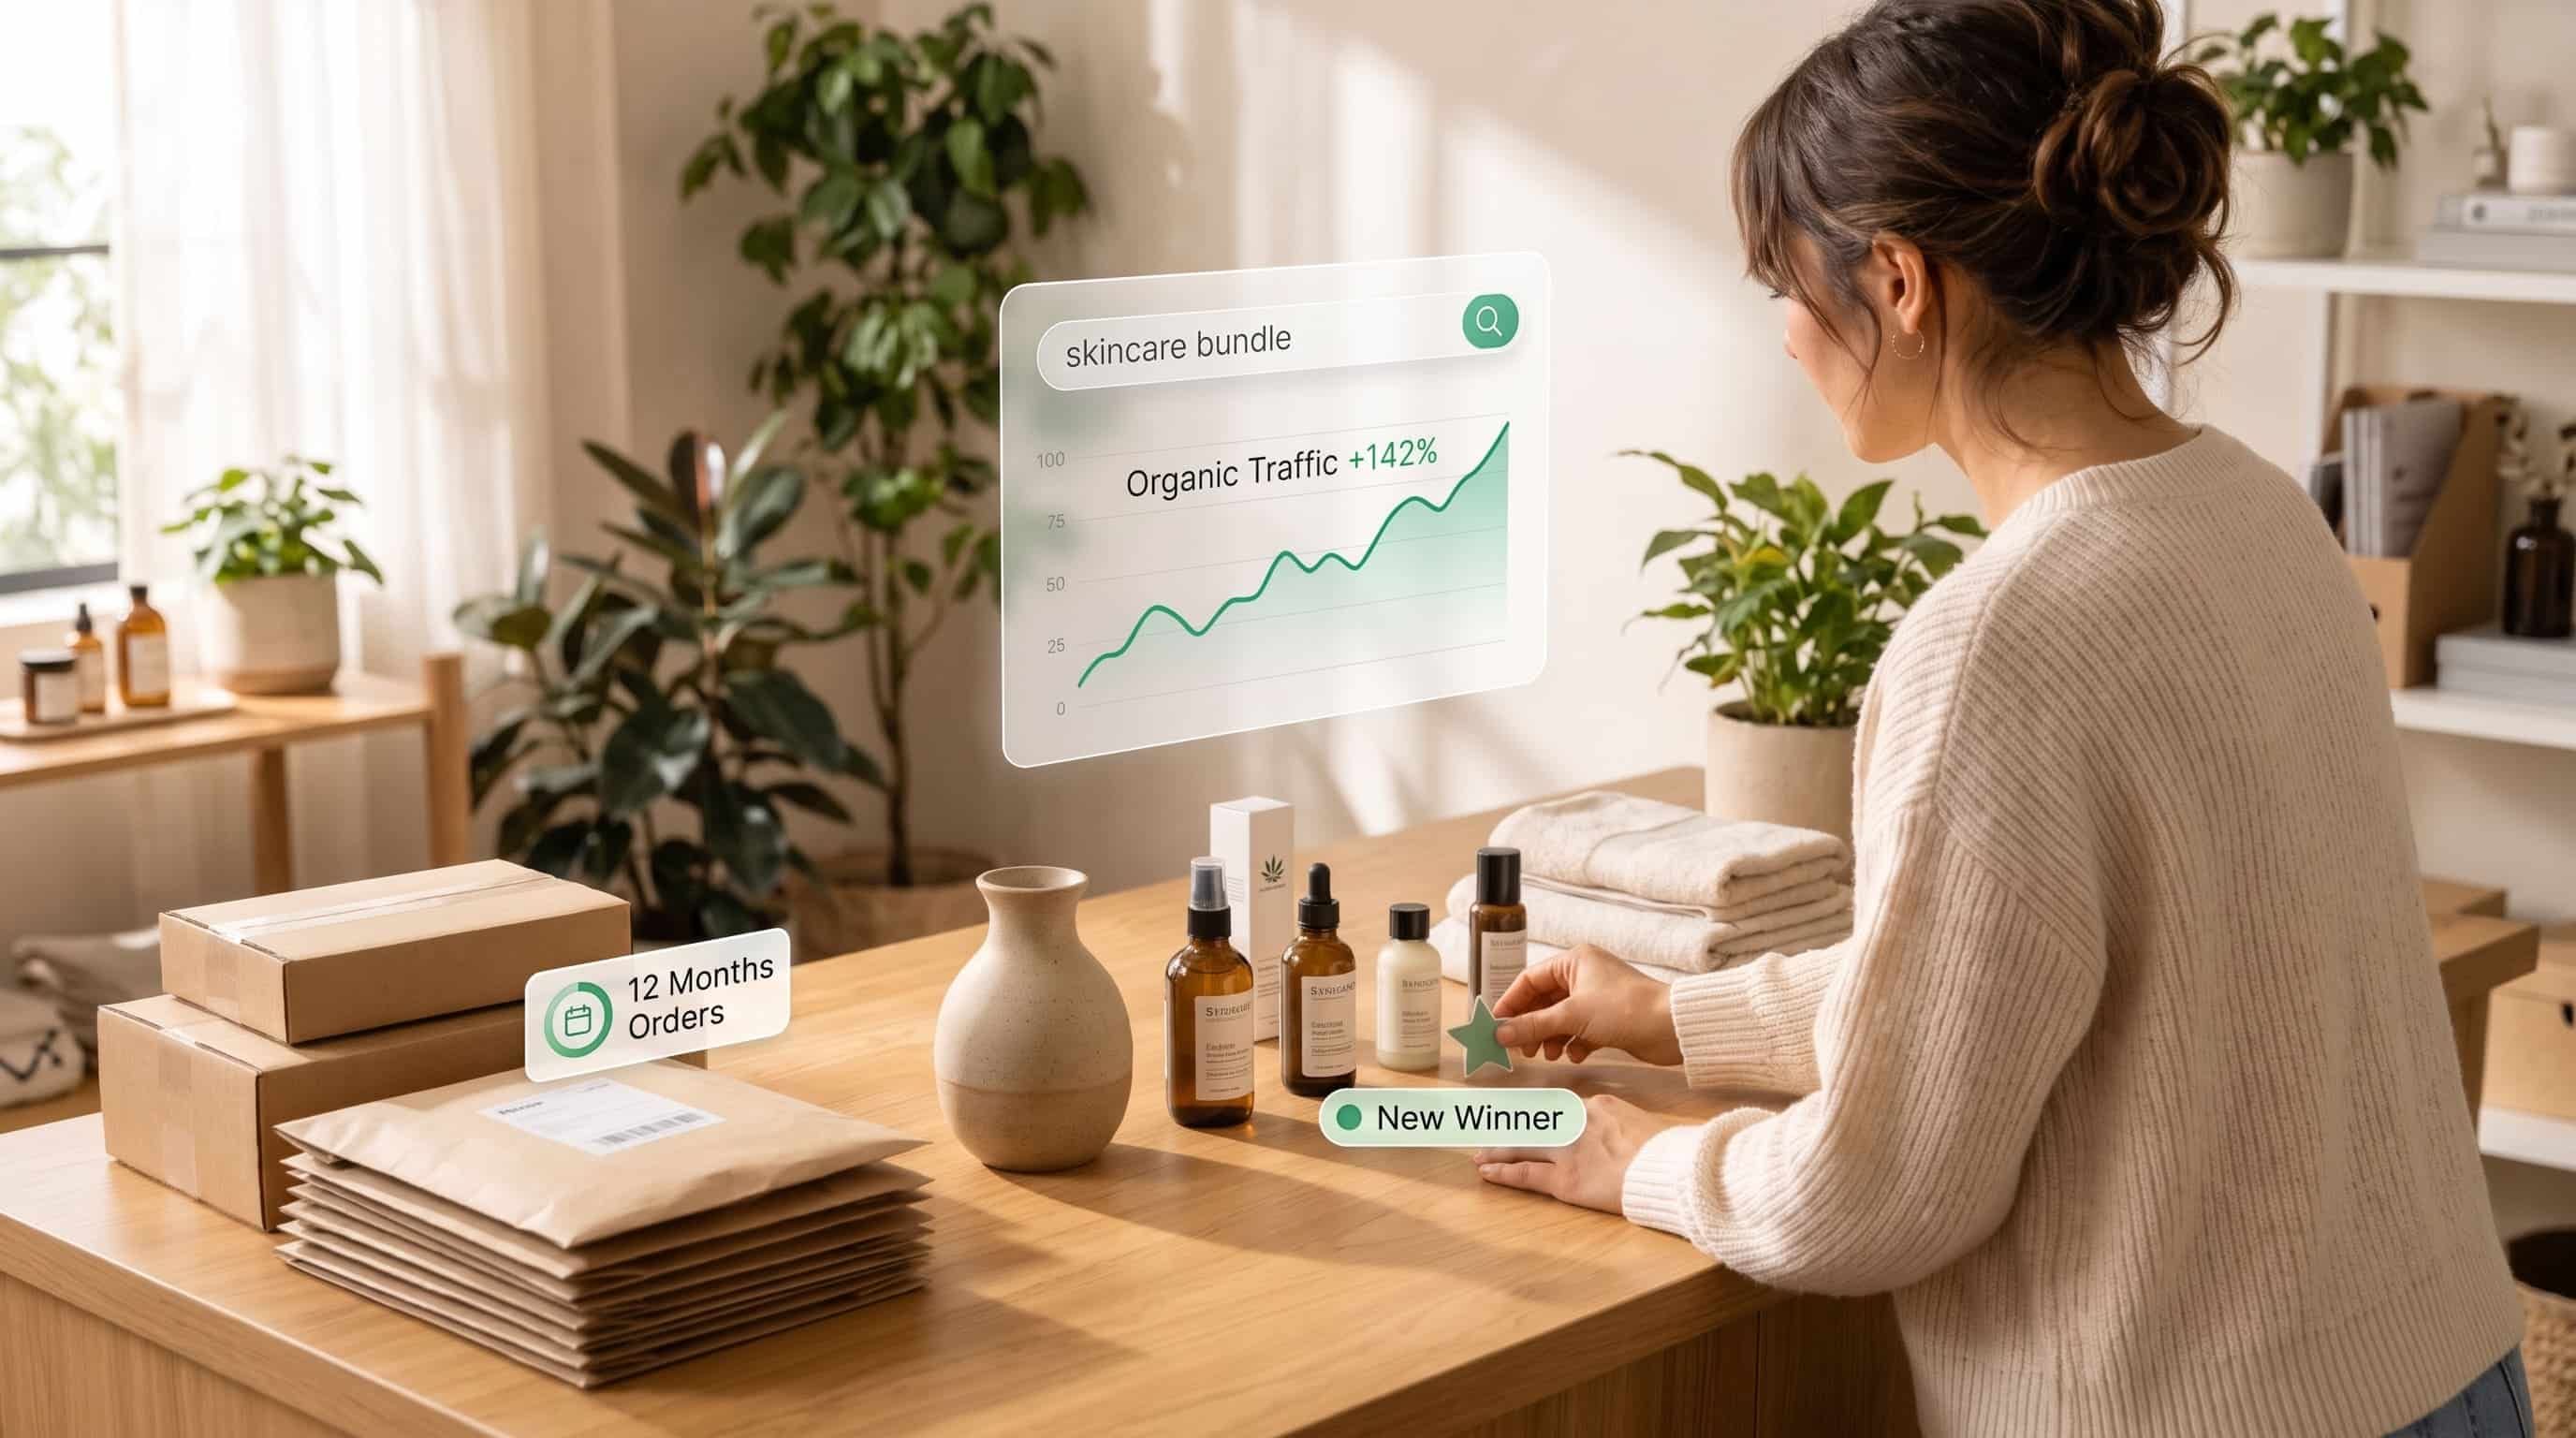
A small Shopify store can turn 12 months of exported order history into a state-indexed market report that uncovers hidden winning SKUs and drives organic traffic without paid ads. In this shopify dropshipping and niche ecommerce case study, pairing first-party sales data with Sell The Trend turns bookkeeping into scalable store growth.
Most merchants treat order logs strictly as accounting records. Yet for any niche brand or Shopify integration store, that CSV export is proprietary, free, and uncovers high-converting winners competitors miss.
While Sell The Trend works as an AI-powered product discovery engine—analyzing 11M+ products across 83 niches via NEXUS AI—your order history reveals how your actual buyers behave. Combining first-party data with predictive research, vetted suppliers, and AI Ads Creator gives merchants an unfair edge.
Key Takeaways
First-Party Data Unlocks Organic Traffic: Hookah Vault turned 12 months of Shopify orders (a few thousand transactions) into The State of Hookah in America 2026, earning newspaper and magazine coverage despite total ad bans on Google, Meta, and TikTok.
Order Exports Expose Winning SKUs: Unit-share analysis showed mint-forward blends driving one-third of sales, a decade-old incumbent losing nearly 20 share points in nine months to Russian newcomers (rising from 5% to 25%), and zero quick-light charcoal ranking in the top 160 sellers.
Population Indexing Protects Store Volume: Dividing state orders by population and indexing against a national average of 100 surfaced regional hotspots—Nevada at 4x the national rate, followed by South Dakota and North Dakota—without exposing raw revenue.
Local Angles Win Media Citations: Splitting one dataset into 50 state stories allowed 17 three-sentence emails to named local reporters to earn editorial placements in month one.
Sell The Trend Scales Every Discovery: Run this four-table audit in an afternoon, then use NEXUS AI, Vetted Dropshipping Suppliers, Store Automation, and AI Ads Creator to expand winning categories fast.
Why Is First-Party Order Data the Most Underused Growth Asset in Ecommerce?
First-party order data is ecommerce’s most underused growth asset because merchants treat transaction logs as bookkeeping rather than live market intelligence. Every Shopify store holds thousands of timestamped, geolocated purchase records that no competitor or agency can copy, turning a routine CSV export into a roadmap for winning products and content built around relevant keywords to attract organic traffic.
Whether you sell on Shopify, track velocity on Amazon, or source from AliExpress, chasing identical viral spikes inflates ad costs and erases margins.
Your order history solves this by capturing real wallet share. Even when running dropshipping automation software where suppliers hold inventory, the shipping states, SKU combinations, and seasonal dates belong exclusively to you.
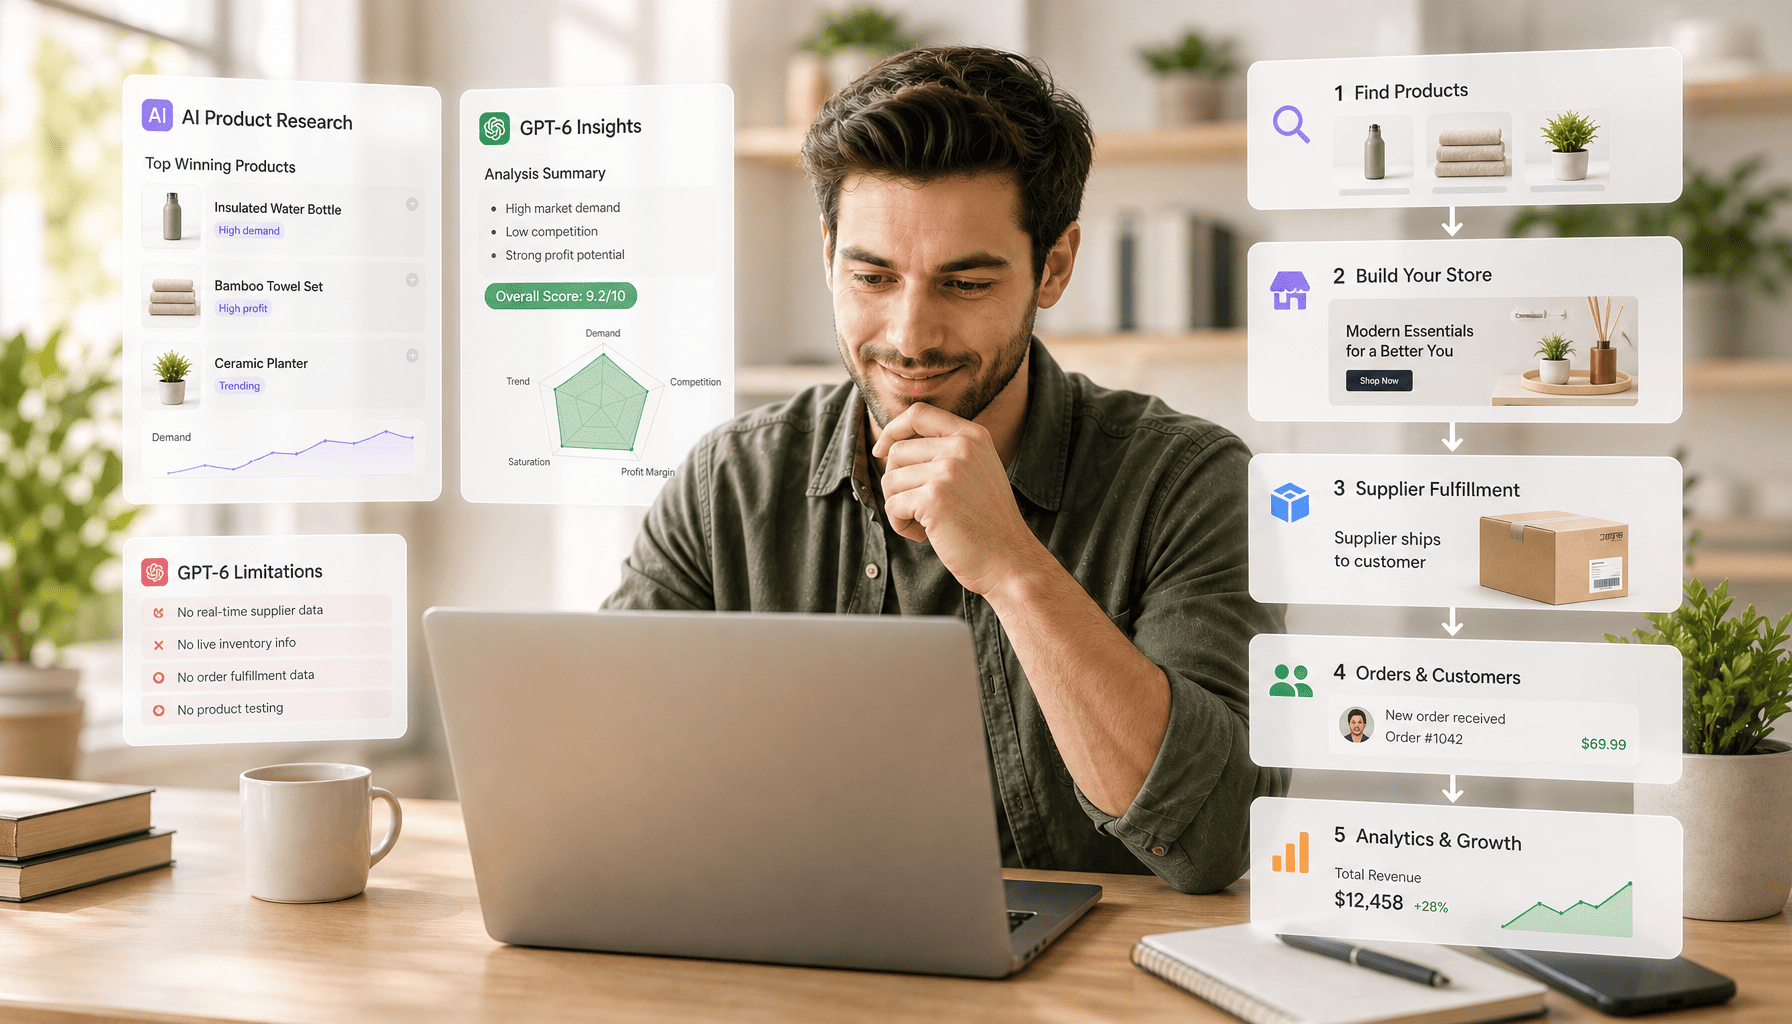
To turn raw transaction logs into forward-looking growth, Sell The Trend pairs dropshipping product research with Product Explorer, real-time inventory sync, and 1-click fulfillment—benchmarking historical winners against predictive trends.
No title
Pro Tip: Never publish raw order counts or dollar revenue in a public market report. Indexing regional demand to a baseline of 100 gives writers crisp, quotable multiples while keeping your true store volume completely private, and those first-party insights also support high-quality content that builds brand awareness through smarter keywords choices.
How Did Hookah Vault Grow Organic Traffic When Paid Ads Were Banned?
Hookah Vault grew organic traffic under total paid ad bans by aggregating twelve months of Shopify orders into an indexed state-by-state market study called The State of Hookah in America 2026. Because tobacco-adjacent stores cannot advertise on Google, Meta, or TikTok, publishing original industry statistics gave journalists a credible source to cite naturally.
Hookah Vault sells hookah pipes, shisha tobacco, and charcoal across every US state—a restricted category that blocks conventional acquisition channels for the business:
Paid Ads Banned: Google, Meta, and TikTok block tobacco-adjacent ads.
Affiliate & Sponsored Limits: Major affiliate networks and sponsored-content marketplaces exclude restricted categories.
Zero Trade Press: Journalists rarely cover individual stores unless given original industry numbers.
Organic search became the main growth channel, requiring strong category pages and credible citations. Although Shopify provides strong technical SEO fundamentals out of the box for an online store, including structured data for products, technical optimization is still essential for improving organic traffic. Instead of guessing what writers wanted, Hookah Vault audited twelve months of orders—a few thousand transactions.
Each order held four non-personal fields: shipping state, product, brand, and order date. Stripped of personal details, aggregated by state, and adjusted for population, that spreadsheet became the only public US hookah market survey.
One afternoon of spreadsheet analysis produced orders per million residents by state, monthly brand share, flavor families, and seasonality—published as a standalone page with a dozen charts, a methodology note, and a plain-language caveat noting the sample reflected one retailer’s customers, the kind of benchmark cited in many Shopify case examples where strong Shopify SEO has contributed to organic traffic gains of 300%.
Three choices made the report quotable: indexing states to a national average of 100 (hiding store volume), using a dated, sourced report format with a named contact and free-use attribution, and publishing as a standalone page rather than a buried blog post so every citation hit one URL.
What Surprising Product and Regional Trends Did the Order Dataset Reveal?
Analyzing twelve months of orders exposed stark geographic anomalies and rapid brand shifts that contradicted industry assumptions. Nevada led at four times the average order rate per resident, South Dakota and North Dakota ranked second and third, and a single mint tobacco SKU generated over ten percent of all units sold.
The strongest findings were single-sentence facts writers could quote directly without calling anyone:
Unexpected State Leaders: Nevada ordered at 4x the national rate per resident—unsurprising given Las Vegas lounges—while South Dakota and North Dakota ranked #2 and #3 per resident, which nobody would have guessed.
Single-SKU Dominance: One mint tobacco product generated more than 10% of every unit sold across the entire store.
Flavor Category Concentration: Mint-forward blends captured one-third (33%) of all sales, despite previously being treated as one flavor among forty.
Rapid Incumbent Disruption: The brand that dominated for a decade lost nearly 20 points of monthly share in nine months to Russian newcomers, which climbed from 5% of monthly units to 25% (a quarter) over the same period.
Category Extinction: Not one quick-light charcoal product made the top 160 sellers, proving buyers had already abandoned the format.
Before pitching a single writer, these findings reshaped Hookah Vault’s catalog: the store cut orders for the declining incumbent, stocked up on surging Russian brands, and rebuilt coal and accessory pages around buyer demand, which also improved the shopping experience for the core consumer. For retail sites, collection and category pages usually deserve optimization first, especially when thin content on product pages makes them harder for search engines to rank. An intent-driven keyword map built around high-intent, long-tail search queries works best when target keywords match the page format and the search intent behind them; for example, a phone-case seller may group “cool phone covers” and “personalized phone cases” into separate destinations instead of forcing both into the same page.
For sellers exploring how to find winning products across broader niches, Sell The Trend’s NEXUS AI automates this diagnostic workflow—tracking real-time order velocity, store adoption curves, and saturation across 11M+ products, while the Niche Finder surfaces best dropshipping niches early.
No title
Pro Tip: Before pitching your report to external writers, use your top-SKU and brand-velocity tables—or Sell The Trend’s NEXUS AI trend curves—to reorganize storefront collections. Promoting items driving 30%+ of unit volume into primary navigation lifts conversion rates before your first press mention goes live.
How Do You Turn One National Dataset into Fifty Local Media Stories?
You turn one national dataset into fifty local stories by segmenting regional over-indexing metrics and pitching state-specific numbers to local beat reporters. Instead of competing in crowded national inboxes, each state breakdown gives city, food, and nightlife journalists an exclusive local angle backed by citable data.
Pitching one national report rarely works because it competes with everything in a national writer’s inbox. Cut by state, that dataset becomes 50 distinct stories—each the only niche data story those writers see all year.
Hookah Vault executed its outreach with localized pitches:
Las Vegas Pitch: Nevada buys more hookah tobacco per resident than any state (4x the national rate).
Detroit Pitch: Michigan is the only big state where a Russian brand outsells the American favorite three to one.
Atlanta Pitch: Georgia ranks as the #1 state for the Atlanta-made brand.
The store sent 17 emails, each three sentences long, to a named writer on a nightlife, food, or city beat. Every email carried a different local number and pointed to the exact same report URL. If a Reddit thread or community post discusses it, check whether a moderator comment is pinned, closed, or removed before using it in outreach.
The store also cited the report inside commissioned lifestyle pieces in a South Florida community paper, a London travel magazine, and a Nashville newspaper—using the data page as the informational source and a category page as the shop link.
How Does First-Party Data Growth Compare to Paid Ads and Standard Content?
First-party data growth outperforms paid ads and standard blog posts in cost efficiency, compounding organic traffic, and customer insight. While paid campaigns stop delivering traffic the moment they spend pauses, one afternoon of spreadsheet analysis builds a permanent asset that attracts press citations and uncovers winners every year.
Growth Strategy
Upfront Time & Cost
Sustainability & Compounding Value
Works in Restricted Niches?
Paid Social & Search Ads
High ongoing daily ad spend
Stops immediately when budget pauses
No (banned on Google, Meta, TikTok)
Standard Ecommerce Blog Posts
Moderate writing cost per post
Rarely cited by journalists or AI engines
Yes, but slow to earn authority
Paid Sponsored Placements Alone
High recurring placement fees
Often tagged as sponsored; limited organic lift
Restricted on major networks
First-Party Order Data Report
1 afternoon analysis + 1 day page build
Compounds annually; 50 reusable local angles
Yes (earns genuine editorial citations)
Data work took one afternoon, layout took one day, and outreach took 17 short emails. In month one, the store earned placements from newspapers and magazines that would never cover a hookah retailer, built an unreplicable asset, and unlocked 50 local angles reusable next year—with search gains maturing over six months. Use google analytics to track the store’s SEO progress as those gains mature.
How Can You Run This Afternoon Data Audit—and Scale Winners with Sell The Trend?
You can run this order audit in one afternoon by exporting twelve months of anonymized Shopify orders, building four pivot tables, and pitching local writers, but put a solid technical SEO foundation in place before you scale content from the audit so the website can rank, because stronger technical SEO and content structure make it easier for search engines to surface the store to potential customers over time. Once your data reveals surging categories and top states, use Sell The Trend to validate new winners, connect vetted suppliers, automate fulfillment, and launch AI ads, while checking mobile page speed because too many third-party apps can slow the site down. Strategic internal linking and structured data improve page visibility by clarifying the structure for search engines across the site. Use the audit to identify the biggest opportunity gap first, then decide whether quality backlinks are worth prioritizing or whether internal linking is the smarter move within your wider marketing process, with search gains maturing over six months, though content refreshes can show ranking improvements in 2–4 months.
Phase 1: Build and Pitch Your Store Data Report (5 Steps)
Step 1: Export Twelve Months of Orders
In Shopify, open Orders, filter for the last 12 months, and export to CSV. Keep four columns: shipping state (or country), product title, vendor or brand, and order date. Delete names and addresses first.
Step 2: Build Four Pivot Tables
Create four views:
Orders by state divided by population, indexed to 100
Monthly unit sales by brand or product
Units by category, flavor, or style
Total orders by month for seasonality
Step 3: Find Five Number-Backed Sentences
Spot the unexpected state, dominant SKU, rising or falling brand, and peak season. Write each insight as one sentence with a number—or slice further until you have five.
Step 4: Publish as a Standalone Page
Use one permanent URL with a dated title, methodology note, charts, caveats, named contact, and free-use attribution line, and use the audit to identify the biggest SEO opportunity before scaling content. Align page titles with the keywords you want to rank for. Tighten product descriptions so the supporting copy matches the same topics and your product titles. Rewrite meta descriptions to reflect the page’s focus and improve click-through context. If you reference related blogs, link them in a simple hub so the page is not orphaned. Link the page from relevant category or resource content to improve authority and visibility. If you have access to Google Search Console, use it with Google Analytics to confirm indexed pages and measure progress. If authority is low in a competitive niche, quality backlinks can help rankings, but internal linking is the practical focus when link building is not in budget. Keep products and discount codes off the page so its sole job is citation.
Step 5: Pitch Local Beat Writers
Email 10 to 20 writers covering over-indexing places (not the product) on Tuesday or Wednesday morning with three sentences: the finding, why it matters this month, and your link. Follow up once a week later (expecting two or three placements) and refresh annually.
Phase 2: Turn Data Findings into Dropshipping Scale with Sell The Trend
Order Data Discovery
Sell The Trend Feature to Activate
How It Accelerates Store Growth
Breakout SKU or Rising Category (e.g., mint blends hitting 33% share)
Launches a conversion-ready niche storefront via Sell The Trend’s AI store builder pre-loaded with validated winners.
Beyond the table above, high-growth stores often use programmatic SEO on Shopify as a scaling process once the team spots repeatable demand patterns, relying on page templates and the right platform setup to generate and manage thousands of pages. Combine Sell The Trend’s Video Ads Creator and TikTok/Facebook Ad Spy Tools with Auto-Pricing Rules to test winning angles fast while protecting profit margins.
No title
Pro Tip: Combine your geographic order report with geo-targeted campaigns inside Sell The Trend’s AI Ads Creator. Focusing initial ad spend on the top 5 states that already over-index organically lowers customer acquisition costs from day one.
Frequently Asked Questions
How many orders does a Shopify store or online store need to publish a credible data report?
A Shopify store can publish a credible report with 1,000 to 5,000 orders over 12 months. Normalizing state figures per capita and adding a methodology caveat noting the sample reflects one retailer’s customers gives journalists valid directional data.
Why should you index state order data to 100 instead of showing raw order totals?
Indexing state demand to a national baseline of 100 protects confidential order volume and revenue from competitors. Indexed multiples like “4x the national rate” are also easier for journalists and AI engines to quote accurately.
Should you publish an annual data study as a blog post or a standalone page?
Always publish an annual study as a standalone page rather than a blog post. A dedicated URL consolidates every citation into one asset and lets you refresh charts annually without splitting organic search authority.
How can dropshipping stores use first-party order data if they do not hold inventory?
Dropshipping stores still own customer shipping states, order dates, and SKU sales mix even when suppliers handle fulfillment. Analyzing those exports uncovers regional spikes and rising products that guide both local PR and catalog expansion via Sell The Trend.
Which Sell The Trend features help scale insights from Shopify order data?
Sell The Trend’s NEXUS AI validates rising categories across 11M+ products, Vetted Dropshipping Suppliers and Store Automation handle sourcing and 1-click fulfillment, and AI Ads Creator turns your strongest state and SKU insights into targeted campaigns that can reach more potential customers organically and through paid promotion. Stores can also scale insights with social proof tools; Lily Charmed increased return customers by 40%.
How Can You Turn Your Store Data into Long-Term Ecommerce Growth?
Most ecommerce brands sit on years of transaction records without turning a single chart into organic traffic or product winners. These results, like many Shopify case studies and broader case studies, show how optimization turns existing data into lasting store authority. Whether you operate in a restricted vertical or a competitive dropshipping niche, an annual order report turns existing data into lasting store authority.
Ready to pair your store’s sales insights with NEXUS AI discovery, vetted supplier automation, and AI Ads Creator? Start your Sell The Trend Free Trial today to uncover winners, sync your Shopify catalog, and scale—just as Ruby Olive increased revenue by 500% through Shopify page optimization and Nuun achieved over 50% year-on-year growth by optimizing Shopify.
Lisa is an eCommerce and digital marketing specialist with over 6 years of experience helping online businesses grow through data-driven strategy and hands-on execution.
She has worked across dropshipping and direct-to-consumer channels, focusing on product research and performance marketing. At Sell The Trend, she creates practical, research-backed content to help merchants make confident decisions.