
Best Dropshipping Products Under $5 in 2026 (Updated Weekly)
Discover high-demand best dropshipping products under $5 backed by real engagement signals, supplier reliability, and margin potential.
Updated November 01, 2026



What are the best dropshipping products under $5?
As of November 2026, our live e-commerce marketplace intelligence database has flagged 10 products meeting the best dropshipping products under $5 threshold. Some of these products are Cucumber Carrot Grater Julienne Peeler, Ginseng Essence Capsules, Moisturizing and Firming Essence Serum, Contains Squalane, Niacinamide, Vitamin E, Retinol, Deep Hydration (0.34Gx30 Capsules)/Bottle-1 Bottle and Squish Surprise Mystery Squishy Blind Box. These items currently feature an average price-to-cost ratio of 6.94x, an average net profit of $12.30 per sale, and an average market saturation score of 2.2%.
Top 10 Best Dropshipping Products Under $5 to Dropship This Week
1. Cucumber Carrot Grater Julienne Peeler

Add to store
See Live Market Data
Add to store
See Live Market Data
What it is: A kitchen tool for grating and peeling vegetables.
The problem: Reduces time and effort in meal prep.
Market status: 3 % saturation
Profit profile: $6.94 net profit per sale with a $5.21 break-even CPA
Primary audience: Home cooks interested in kitchen gadgets
Ad strategy: Launch on Facebook using Video demonstration of usage
NEXUS insight: High monthly revenue with low market saturation indicates strong demand.
| Metric | Value |
|---|---|
| Sourcing Cost | $1.55 |
| Suggested Price | $8.49 |
| Net Profit Margin | $6.94 (81.74%) |
| Break-Even CPA | $6.94 |
| Saturation Level | 3% |
2. Ginseng Essence Capsules, Moisturizing and Firming Essence Serum, Contains Squalane, Niacinamide, Vitamin E, Retinol, Deep Hydration (0.34Gx30 Capsules)/Bottle-1 Bottle

Add to store
See Live Market Data
Add to store
See Live Market Data
| Metric | Value |
|---|---|
| Sourcing Cost | $2.22 |
| Suggested Price | $33.50 |
| Net Profit Margin | $31.28 (93.37%) |
| Break-Even CPA | $31.28 |
| Saturation Level | 3% |
3. Squish Surprise Mystery Squishy Blind Box

Add to store
See Live Market Data
Add to store
See Live Market Data
| Metric | Value |
|---|---|
| Sourcing Cost | $1.93 |
| Suggested Price | $8.99 |
| Net Profit Margin | $7.06 (78.53%) |
| Break-Even CPA | $7.06 |
| Saturation Level | 2% |
4. COB LED Headlamp Rechargeable Motion Sensor 230° Wide Beam Torch Light

Add to store
See Live Market Data
Add to store
See Live Market Data
| Metric | Value |
|---|---|
| Sourcing Cost | $4.14 |
| Suggested Price | $20.24 |
| Net Profit Margin | $16.10 (79.55%) |
| Break-Even CPA | $16.10 |
| Saturation Level | 2% |
5. Moisturizing lip oil gloss pink plumping exfoliation

Add to store
See Live Market Data
Add to store
See Live Market Data
What it is: A cosmetic lip oil for hydration and plumping.
The problem: Dry lips lacking volume and smooth texture.
Market status: 2 % saturation
Profit profile: $30.88 net profit per sale with a $23.16 break-even CPA
Primary audience: Women interested in beauty products
Ad strategy: Launch on Instagram using Influencer testimonials and demonstrations
NEXUS insight: Strong profit margins and low market saturation indicate high sales potential.
| Metric | Value |
|---|---|
| Sourcing Cost | $2.16 |
| Suggested Price | $32.99 |
| Net Profit Margin | $30.83 (93.45%) |
| Break-Even CPA | $30.83 |
| Saturation Level | 2% |
6. Right Angle USB-C Quick Charging & Data Transfer Cable

Add to store
See Live Market Data
Add to store
See Live Market Data
What it is: A cable for rapid charging and data transfer.
The problem: Inconvenient charging angles and slow data transfer.
Market status: 2 % saturation
Profit profile: $9.68 net profit per sale with a $7.26 break-even CPA
Primary audience: Tech-savvy consumers interested in gadgets
Ad strategy: Launch on Facebook using Video demo
NEXUS insight: Low saturation and high margin suggest a strong market opportunity.
| Metric | Value |
|---|---|
| Sourcing Cost | $2.18 |
| Suggested Price | $11.99 |
| Net Profit Margin | $9.81 (81.82%) |
| Break-Even CPA | $9.81 |
| Saturation Level | 2% |
7. Car Seat Gap Fillers with Storage Slots, 2-Piece Set

Add to store
See Live Market Data
Add to store
See Live Market Data
| Metric | Value |
|---|---|
| Sourcing Cost | $2.53 |
| Suggested Price | $9.99 |
| Net Profit Margin | $7.46 (74.67%) |
| Break-Even CPA | $7.46 |
| Saturation Level | 2% |
8. Toothpaste Dispenser Cream Tube Squeezer

Add to store
See Live Market Data
Add to store
See Live Market Data
| Metric | Value |
|---|---|
| Sourcing Cost | $1.19 |
| Suggested Price | $3.46 |
| Net Profit Margin | $2.27 (65.61%) |
| Break-Even CPA | $2.27 |
| Saturation Level | 2% |
9. Squishies Nee Doh Jellyfish Squish Toy Fidget Toy, Water Sensory Soft Jelly Squeeze Stress Relief Fidget Toy Squeeze Blind Box

Add to store
See Live Market Data
Add to store
See Live Market Data
| Metric | Value |
|---|---|
| Sourcing Cost | $3.92 |
| Suggested Price | $8.00 |
| Net Profit Margin | $4.08 (51%) |
| Break-Even CPA | $4.08 |
| Saturation Level | 2% |
10. Seven-Color Star Hydrocolloid Pimple Patches

Add to store
See Live Market Data
Add to store
See Live Market Data
| Metric | Value |
|---|---|
| Sourcing Cost | $0.83 |
| Suggested Price | $7.99 |
| Net Profit Margin | $7.16 (89.61%) |
| Break-Even CPA | $7.16 |
| Saturation Level | 2% |
Buying Trends
| Metric | This Week’s Average | What It Means |
|---|---|---|
| Shipping duration | 5–12 days | Average US shipping window across featured suppliers |
| Orders | 22,553 | Average lifetime order volume on featured products |
| Daily orders | +246.3 | Average day-over-day order momentum (Day Change) |
| Saturation # | 2.2% | Average active-store saturation across the shortlist |
| Average profit | $12.30 | Average net profit per sale (selling price − cost) |
| Average margin | 78.9% | Average profit as a percent of selling price |
| Average selling price | $14.56 | Average competitor retail price on featured products |
| Average shipping cost | $4.99 | Average cheapest US shipping option for cost suppliers |
| Most common price range | $0–$20 | Most frequent selling-price bucket in this week’s shortlist |
| Top selling countries | United States, France, Spain, Israel, United Kingdom | Top customer countries from AliExpress review geography |
| Average price-to-cost | 6.94x | Average (selling + shipping) ÷ sourcing cost |

How We Selected These Products
These rankings are generated using live marketplace intelligence from Sell The Trend’s product research platform, not manual editorial opinions. Every report analyzes products against criteria such as:
- Competition level (market saturation)
- Order volume and sales momentum
- Profit margin and selling potential
- Supplier quality and fulfillment reliability
- Shipping speed and availability
- Product trend velocity
- Social engagement and advertising activity (where applicable)
- Marketplace-specific performance (TikTok Shop, AliExpress, Amazon, Facebook Ads, TikTok Ads, etc.)
Products are then ranked using the filters and scoring methodology defined for this report to identify the strongest opportunities.
Market Insights
Data Sources
This report was built with Sell The Trend’s live research tools. Each explorer below contributed a layer of marketplace intelligence — product discovery, demand validation, ad traction, supplier cost, and store competition — that we combined into the rankings, averages, and insights on this page.



Sell The Trend NEXUS AI
NEXUS AI supplied the core product shortlist for this report — scanning millions of marketplace listings for margin, saturation, and order momentum so only high-potential items made the ranking.
Explore NEXUS AITikTok Shop Winners
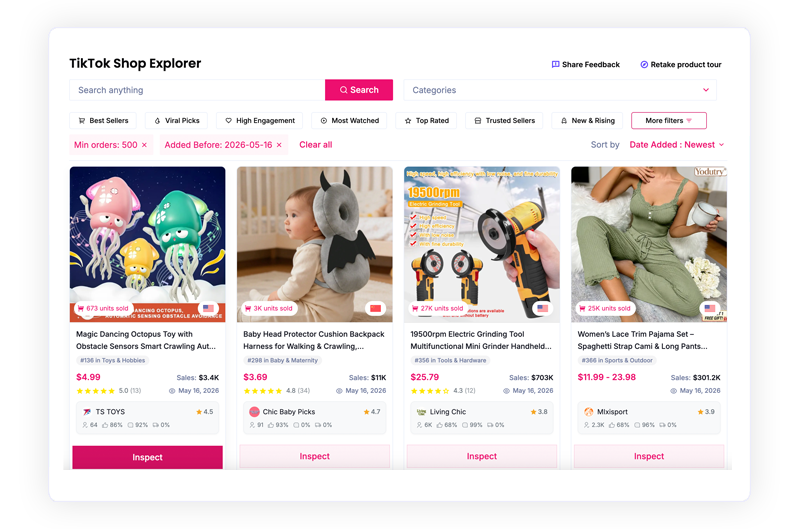
TikTok Shop Winners contributed live TikTok commerce signals — product sales, pricing, and store performance — used to confirm which featured items already convert on TikTok Shop.
Open TikTok Shop WinnersTikTok Ads Explorer
TikTok Ads Explorer fed engagement and creative velocity data into this report, helping measure demand strength and ad angles behind products gaining traction on TikTok.
Open TikTok Ads ExplorerFacebook Ads Explorer
Facebook Ads Explorer surfaced winning creatives, offers, and product links from top-performing stores — used here to validate advertising demand behind the ranked products.
Open Facebook Ads ExplorerAliExpress Explorer
AliExpress Explorer provided supplier cost, shipping, and fulfillment signals that powered cost, profit margin, and sourcing metrics shown throughout this report.
Open AliExpress ExplorerAmazon Explorer
Amazon Explorer added marketplace competition and pricing context, helping size opportunity and cross-check demand for products featured in this ranking.
Open Amazon ExplorerShopify Store Analysis
Store Intelligence reverse-engineered Shopify sellers — best sellers, retail pricing, and live store signals — used to calculate selling prices, saturation, and competitive density in this report.
Open Shopify Store AnalysisReal Results from Real Sellers
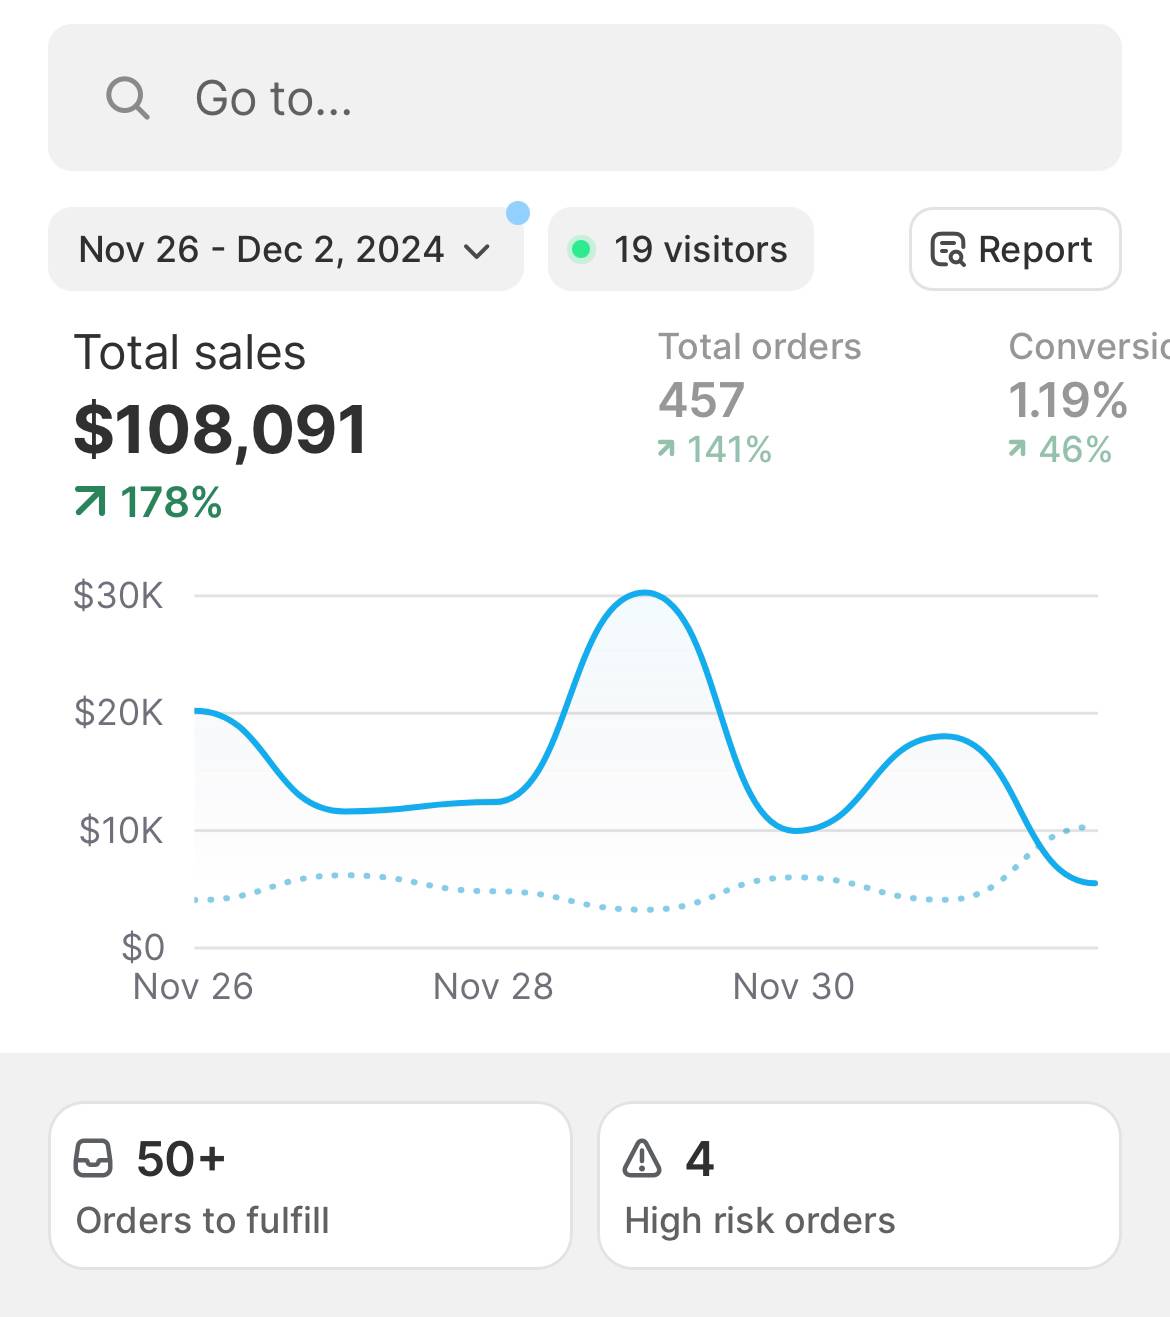
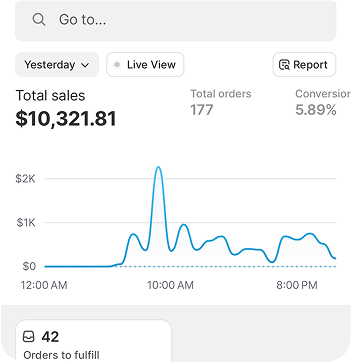
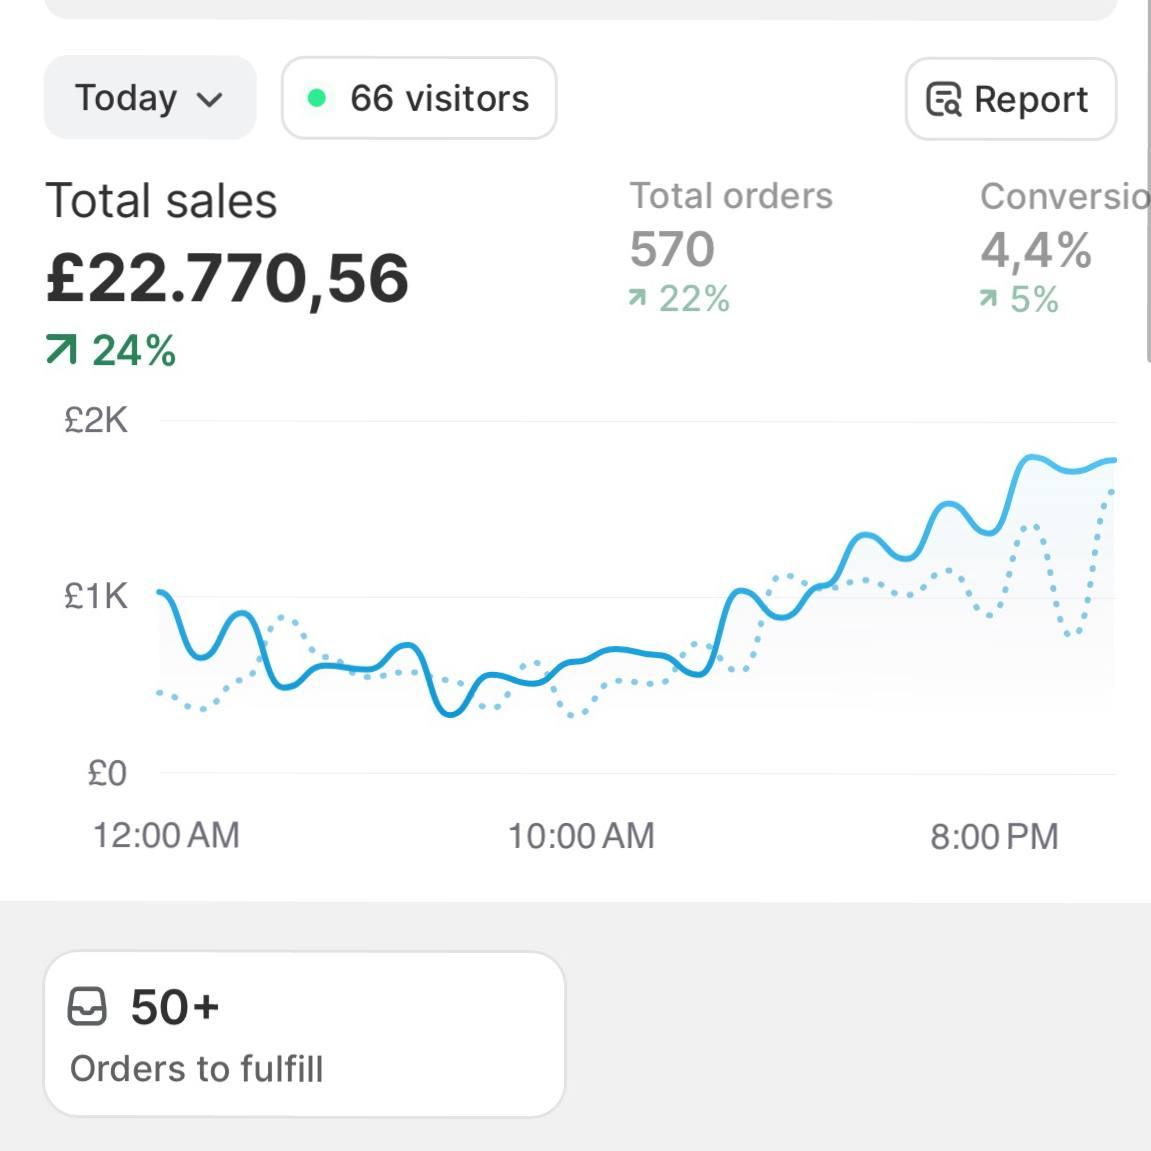
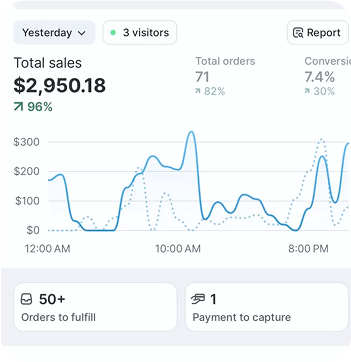
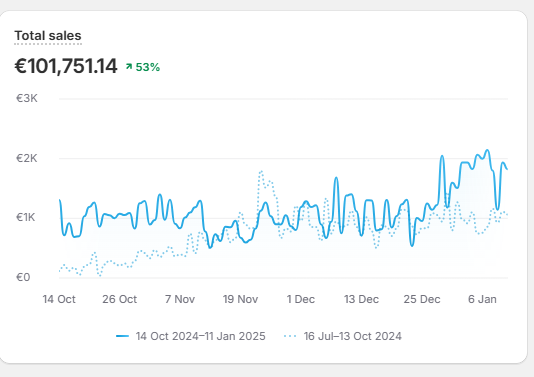
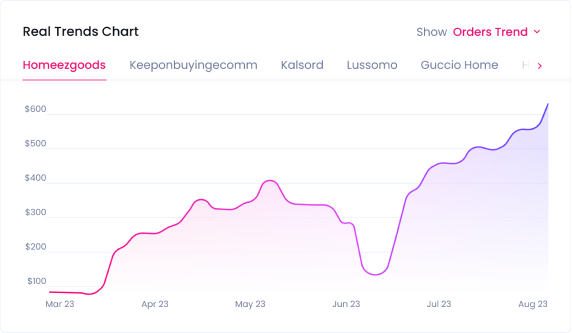
See how dropshippers from around the world are growing their stores with Sell The Trend.






Inspected by Rachid “Rush” Wehbi
Founder of Sell The Trend, Rush is a data-driven entrepreneur with over 10 years of experience in e-commerce, automation, and product discovery. Each article is reviewed to ensure it reflects real-world workflows, industry insights, and platform-level accuracy.
Frequently asked questions
What makes a product low competition?
Low-competition products have fewer active stores selling them and lower saturation scores, which typically means less crowded ads and more room to win early.
How often is this updated?
This report is refreshed weekly using the latest available marketplace data for best dropshipping products under $5.
Where does the data come from?
Depending on the report, data may be collected from Sell The Trend NEXUS AI, TikTok Shop Winners, TikTok Ads Explorer, Facebook Ads Explorer, AliExpress Explorer, Amazon Explorer, and Shopify Store Analysis.
Can I import these into Shopify?
Yes. You can push researched products into Shopify and other supported store platforms directly from Sell The Trend.
What is saturation?
Saturation measures how many active stores already sell a product. Lower saturation usually means less competition.
How is profit calculated?
Profit is estimated from selling price minus sourcing cost, using live marketplace pricing and cost signals.
How are products ranked in this report?
Products are filtered by this report’s criteria, then ranked with Sell The Trend’s scoring methodology to surface the strongest opportunities.
Is this based on editorial opinions?
No. Rankings are generated from live marketplace intelligence on Sell The Trend’s product research platform.